Logging And Metrics
Overview
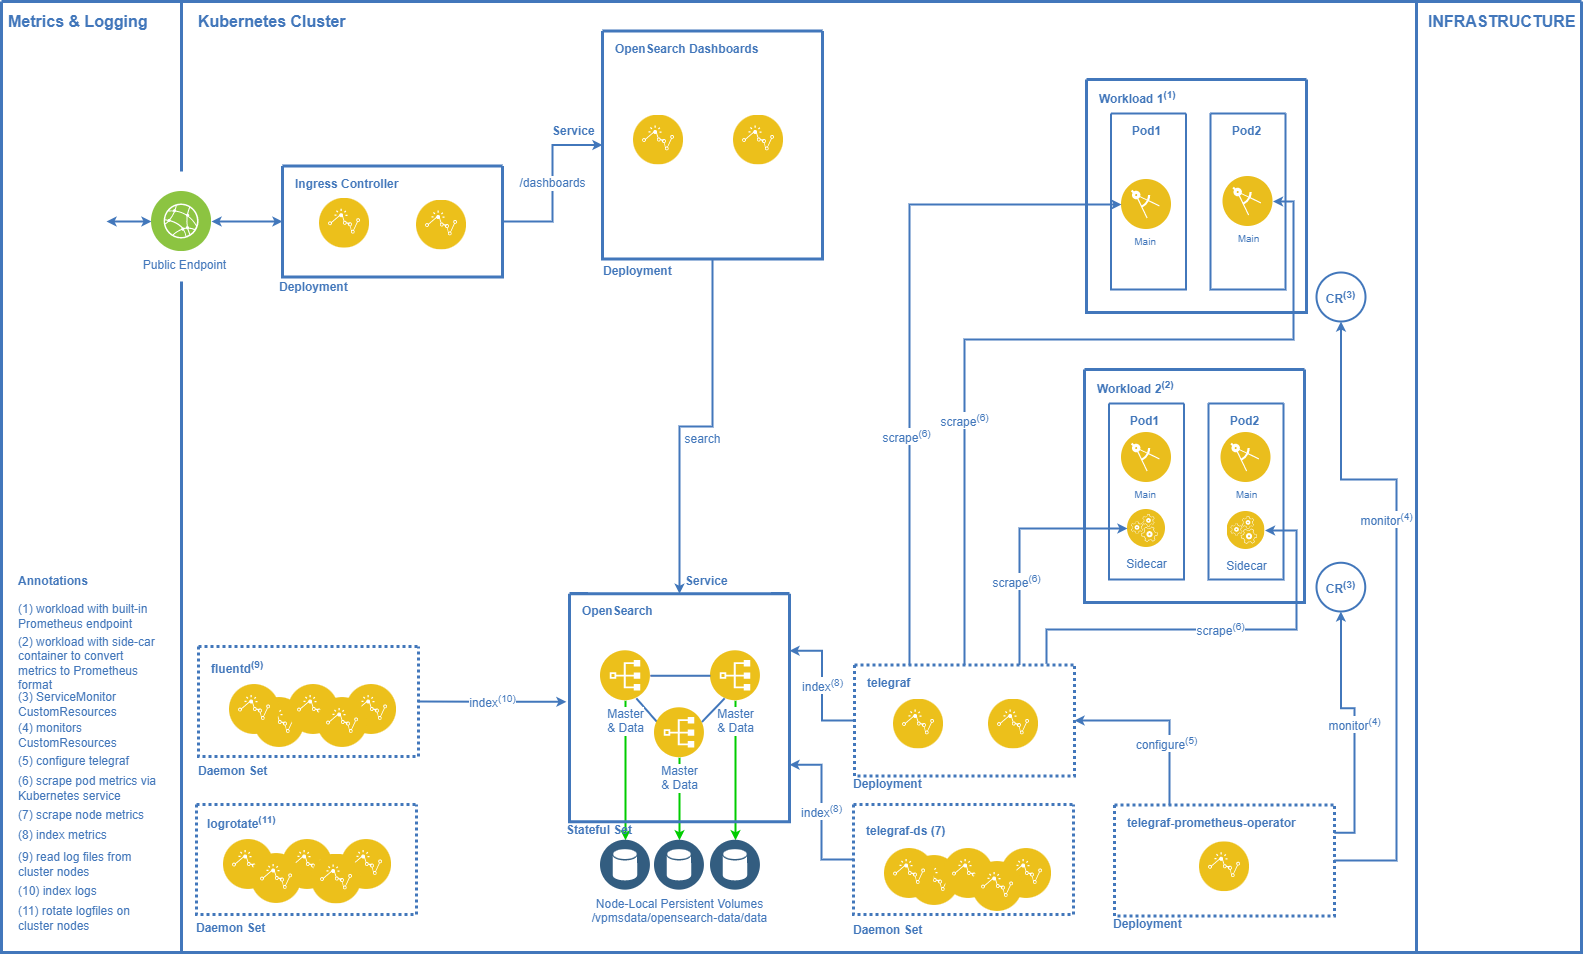
Log and metrics collection, visualisation, and analysis are a key aspect for operating and maintaining a system. A Vidispine MAM system uses the following components for handling logs and metrics:
OpenSearch: store logs and metrics in OpenSearch indices.
OpenSearch Dashboards: view and analyse logs and metrics; configure alerts on metrics.
fluentd: collection log output from Kubernetes workload.
telegraf: collect metrics from Kubernetes workload.
telegraf-ds: collect metrics from Kubernetes nodes.
telegraf-prometheus-operator: identify the Kubernetes workload exposing metrics and configure telegraf appropriately.
Prometheus endpoints: are built into Kubernetes workload to expose metrics in the Prometheus format.
Prometheus exporters: sidecar containers on Kubernetes workload which expose metrices in a different format to convert them into the Prometheus format.
As all workload exposes metrics in the Prometheus format, a different toolset may be used to collect metrics from the system. This allows integration of Vidispine metrics into an existing metrics collection system.
Log Collection
fluentdis running as DaemonSet on all cluster nodes.fluentdis collecting log files from the cluster nodes and writes them to OpenSearch indices.The
logrorateDaemonSet is rotating the logfiles on the cluster nodes (optional, can also be done directly on the operating system level of the nodes).
Metrics Collection
Each workload comes with a CustomResource of type
ServiceMonitorcontaining information on the Prometheus metrics endpoint of the corresponding workload.The
telegraf-prometheus-operatormonitors all CustomResources of this type and configurestelegrafappropriately.The
telegrafdeployment scrapes metrics from all configured endpoints and writes them to OpenSearch indices.The
telegraf-dsDaemonSet scrapes metrics from all cluster nodes and writes them to OpenSearch indices.

