
Enabling Logging Information in Frontend [VE OG]
The web debugger built into today's web browsers, such as Google Chrome, is a powerful tool to understand scenarios happening in the VidiEditor frontend. By default, only limited data is logged into the console. When trying to understand problems or on support or test machines, it might make sense to enable the extended logging information. This can easily be done in the web debugger itself.
In Google Chrome open web debugger (F12)
Go to “Application → Local Storage → VidiEditor URL“
Add a new key value pair: ME_ENABLE_CONSOLE: true
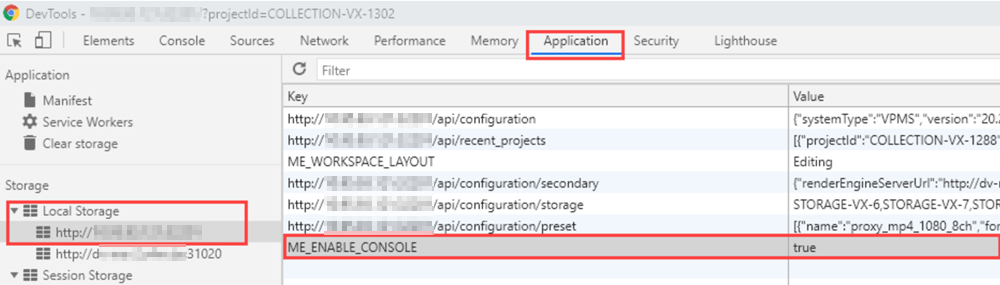
As a result, you will see extended logging information now in the web debugger’s “Console” tab.