OpenTelemetry [VE OG]
For further details, please check the official OpenTelemetry Documentation.
OpenTelemetry (informally called OTEL or OTel) is an observability framework – software and tools that assist in generating and capturing telemetry data from cloud-native software.
OpenTelemetry aims to address the full range of observability signals across traces, metrics and logs.
VidiEditor has expose telemetry data via OTEL/HTTP protocol

To illustrate how the telemetry data flow for visualization (in this case is OpenSearch)
Visualization
In order to visualize the traces and metrics data, here is few setup required.
Data Prepper
OpenTelemetry Operator (Collector)
VE deployment
You can just proceed to VE development, if you have already done so for Data Prepper and OpenTelemetry Operator setup.
Data Prepper:
Data Prepper is a server-side data collector capable of filtering, enriching, transforming, normalizing, and aggregating data for downstream analytics and visualization.
To read more about data prepper, data-prepper.
For data-prepper setup, please check data-prepper-deployment.
kind: ConfigMap:
Provides pods 2 configuration files required to launch a Data Prepper instance, required some adjustment. In the example below we are using elastic/opensearch, so need to provide opensearch endpoint, username/password accordingly.
pipelines.yaml
apiVersion: v1
kind: ConfigMap
metadata:
  labels:
    app: data-prepper
  name: data-prepper-pipeline
  namespace: teamvidieditor-obs
data:
  pipelines.yaml: |
    metrics-pipeline:
      workers: 1
      delay: "5000"
      source:
        otel_metrics_source:
          ssl: false
      processor:
        - otel_metrics_raw_processor:
      sink:
        - opensearch:
            hosts: [ "https://vpc-team-vidieditor-z3r6o5dbnoeuach3ac7tnnx3ti.eu-central-1.es.amazonaws.com:443" ]
            username: username
            password: password
            index: metrics-otel-v1-%{yyyy.MM.dd}
    logs-pipeline:
      source:
        otel_logs_source:
          ssl: false
      processor:
      sink:
        - stdout:
        - opensearch:
            hosts: [ "https://vpc-team-vidieditor-z3r6o5dbnoeuach3ac7tnnx3ti.eu-central-1.es.amazonaws.com:443" ]
            username: username
            password: password
            index: logs-otel-v1-%{yyyy.MM.dd}
    entry-pipeline:
      delay: "100"
      source:
        otel_trace_source:
          health_check_service: true
          ssl: false
      sink:
        - pipeline:
            name: "raw-pipeline"
        - pipeline:
            name: "service-map-pipeline"
    raw-pipeline:
      source:
        pipeline:
          name: "entry-pipeline"
      processor:
        - otel_trace_raw:
        - otel_trace_group:
            hosts: [ "https://vpc-team-vidieditor-z3r6o5dbnoeuach3ac7tnnx3ti.eu-central-1.es.amazonaws.com:443" ]
            username: username
            password: password
      sink:
        - opensearch:
            hosts: [ "https://vpc-team-vidieditor-z3r6o5dbnoeuach3ac7tnnx3ti.eu-central-1.es.amazonaws.com:443" ]
            username: username
            password: password
            index_type: trace-analytics-raw
    service-map-pipeline:
      delay: "100"
      source:
        pipeline:
          name: "entry-pipeline"
      processor:
        - service_map_stateful:
      sink:
        - opensearch:
            hosts: [ "https://vpc-team-vidieditor-z3r6o5dbnoeuach3ac7tnnx3ti.eu-central-1.es.amazonaws.com:443" ]
            username: username
            password: password
            index_type: trace-analytics-service-map
data-prepper-config.yaml
apiVersion: v1
kind: ConfigMap
metadata:
  labels:
    app: data-prepper
  name: data-prepper-config
  namespace: teamvidieditor-obs
data:
  data-prepper-config.yaml: |
    ssl: false
kind: Service:
apiVersion: v1
kind: Service
metadata:
  labels:
    app: data-prepper
  name: data-prepper
  namespace: teamvidieditor-obs
spec:
  ports:
    - name: '21890'
      protocol: TCP
      port: 21890
      targetPort: 21890
    - name: '21891'
      protocol: TCP
      port: 21891
      targetPort: 21891
    - name: '21892'
      protocol: TCP
      port: 21892
      targetPort: 21892
  selector:
    app: data-prepper
status:
  loadBalancer: {}
kind: Deployment:
apiVersion: apps/v1
kind: Deployment
metadata:
  labels:
    app: data-prepper
  name: data-prepper
  namespace: teamvidieditor-obs
spec:
  replicas: 1
  selector:
    matchLabels:
      app: data-prepper
  strategy:
    type: Recreate
  template:
    metadata:
      labels:
        app: data-prepper
    spec:
      volumes:
        - name: data-prepper-config
          configMap:
            name: data-prepper-config
            items:
              - key: data-prepper-config.yaml
                path: data-prepper-config.yaml
            defaultMode: 420
        - name: data-prepper-pipeline
          configMap:
            name: data-prepper-pipeline
            items:
              - key: pipelines.yaml
                path: pipelines.yaml
            defaultMode: 420
      containers:
        - name: data-prepper
          image: opensearchproject/data-prepper:2.1.1
          ports:
            - containerPort: 21890
              protocol: TCP
            - containerPort: 21891
              protocol: TCP
            - containerPort: 21892
              protocol: TCP
          resources: {}
          volumeMounts:
            - name: data-prepper-config
              mountPath: /usr/share/data-prepper/config/data-prepper-config.yaml
              subPath: data-prepper-config.yaml
            - name: data-prepper-pipeline
              mountPath: /usr/share/data-prepper/pipelines/pipelines.yaml
              subPath: pipelines.yaml
      restartPolicy: Always
      serviceAccountName: ""
status: {}
OTEL Collector:
For detail, please check OTEL Operator
The OpenTelemetry Collector consists of three components:
Receivers: Can be push or pull based, is how data gets into the Collector.Processors: Run on data between being received and being exported.Exporters: Can be push or pull based, is how you send data to one or more backends/destinations.
Adjust exporter accordingly depend on your setup.
apiVersion: opentelemetry.io/v1alpha1
kind: OpenTelemetryCollector
metadata:
  name: trace-collector
  namespace: teamvidieditor-obs
spec:
  config: |
    receivers:
      otlp:
        protocols:
          grpc:
          http:
    processors:
      memory_limiter:
        check_interval: 1s
        limit_percentage: 75
        spike_limit_percentage: 15
      batch:
        send_batch_size: 10000
        timeout: 10s

    exporters:
      logging:
        verbosity: detailed
      otlphttp:
        traces_endpoint: https://ingest.lightstep.com:443/traces/otlp/v0.9
        metrics_endpoint: https://ingest.lightstep.com:443/metrics/otlp/v0.9
        compression: gzip
        headers:
          "lightstep-access-token": "IaCW/V8nUrTABU8v4MPxSvsnmxLkjsUHpcdbkOK4I0CEvN84npmsrcKWXZ6mwRmSa7rt3O3D/nc+1VMekCFIRW/QhQESXmxuPSrBasm7"
      otlp/data-prepper-traces:
        endpoint: http://data-prepper.teamvidieditor-obs:21890
        tls:
          insecure: true
      otlp/data-prepper-logs:
        endpoint: http://data-prepper.teamvidieditor-obs:21892
        tls:
          insecure: true
      otlp/data-prepper-metrics:
        endpoint: http://data-prepper.teamvidieditor-obs:21891
        tls:
          insecure: true

    service:
      telemetry:
        logs:
          level: "debug"
      pipelines:
        traces:
          receivers: [otlp]
          exporters: [logging,otlp/data-prepper-traces]
          processors: [batch]
        metrics:
          receivers: [otlp]
          exporters: [logging, otlp/data-prepper-metrics]
          processors: [batch]
        logs:
          receivers: [otlp]
          exporters: [logging, otlp/data-prepper-logs]
          processors: [memory_limiter,batch]
VE Deployment:
And lastly during VidiEditor deployment, need to provide OTLP(HTTP) endpoint (collector) by setting the value to 'OTEL_EXPORTER_OTLP_ENDPOINT' environment variable in the pod or update VE system yaml file accordingly.
vidieditor:
  default:
    helm_chart:
      chart_values:
        hull:
          objects:
            deployment:
              vidieditor:
                pod:
                  containers:
                    vidieditor:
                      env:
                        'OTEL_EXPORTER_OTLP_ENDPOINT':
                          value: 'http://traces-collector-collector.teamvidieditor-obs:4318'
How to view the data via OpenSearch dashboard:
Before viewing the data, need to create the index pattens first. Click the sidebar.
.png?inst-v=ac5a53fd-a319-41fb-80ef-9ab4c441b714)
Scroll down the sidebar and click the stack management button.
.png?inst-v=ac5a53fd-a319-41fb-80ef-9ab4c441b714)
Then click the index patterns button on the left upper corner.
.png?inst-v=ac5a53fd-a319-41fb-80ef-9ab4c441b714)
Click the create index pattern button to add new index pattern.
.png?inst-v=ac5a53fd-a319-41fb-80ef-9ab4c441b714)
Type the index pattern name wanted to be added and click next step button.
.png?inst-v=ac5a53fd-a319-41fb-80ef-9ab4c441b714)
Choose the time field and click the create index pattern button, the index pattern will be successfully added.
.png?inst-v=ac5a53fd-a319-41fb-80ef-9ab4c441b714)
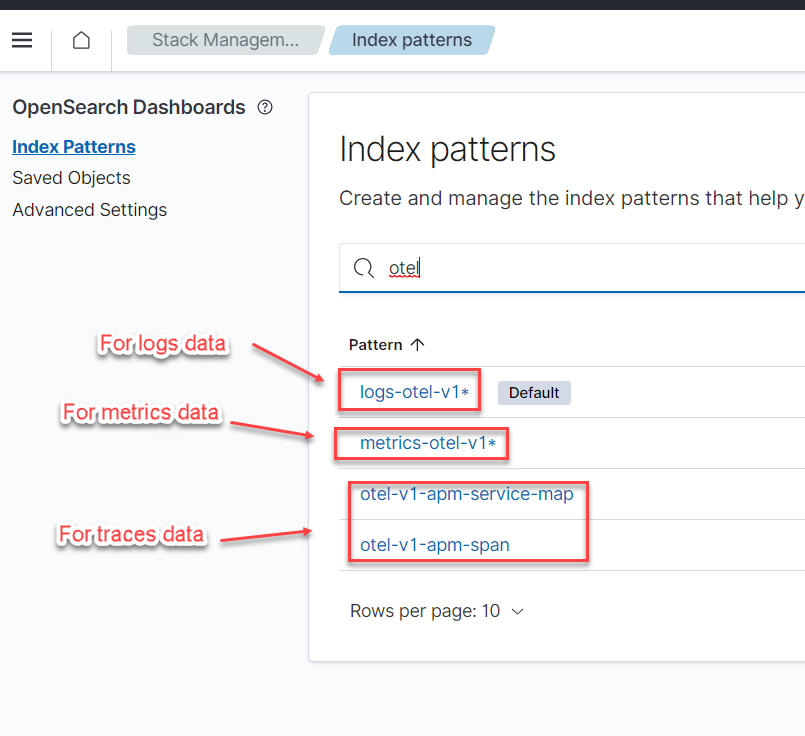
Notes: example: telemetry data exposed with these prefixes, please refer back to data-prepper configmap, index section
- metrics-otel-*
- logs-otel-*

After adding all the index patterns, click the sidebar and the discover button.
.png?inst-v=ac5a53fd-a319-41fb-80ef-9ab4c441b714)
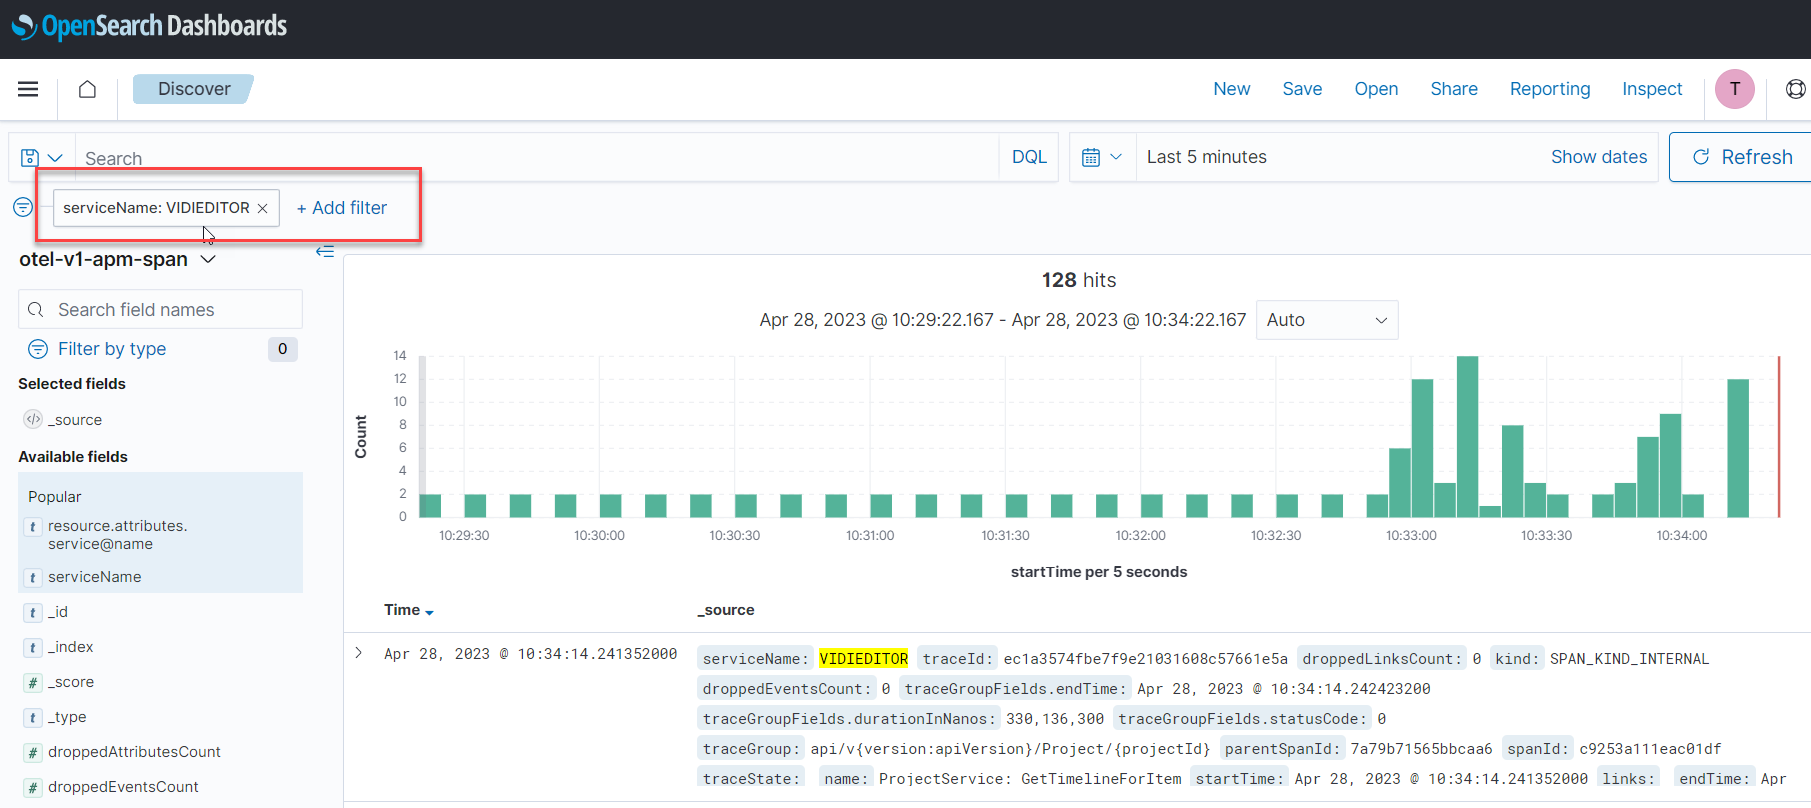
In the discover section, able to explore data, analyze data and visualize data. See this article for more information.
.png?inst-v=ac5a53fd-a319-41fb-80ef-9ab4c441b714)
filter with serviceName: VIDIEDITOR to view only VidiEditor data

Another way to view and analysis the data. Click the sidebar and the observability button.
.png?inst-v=ac5a53fd-a319-41fb-80ef-9ab4c441b714)
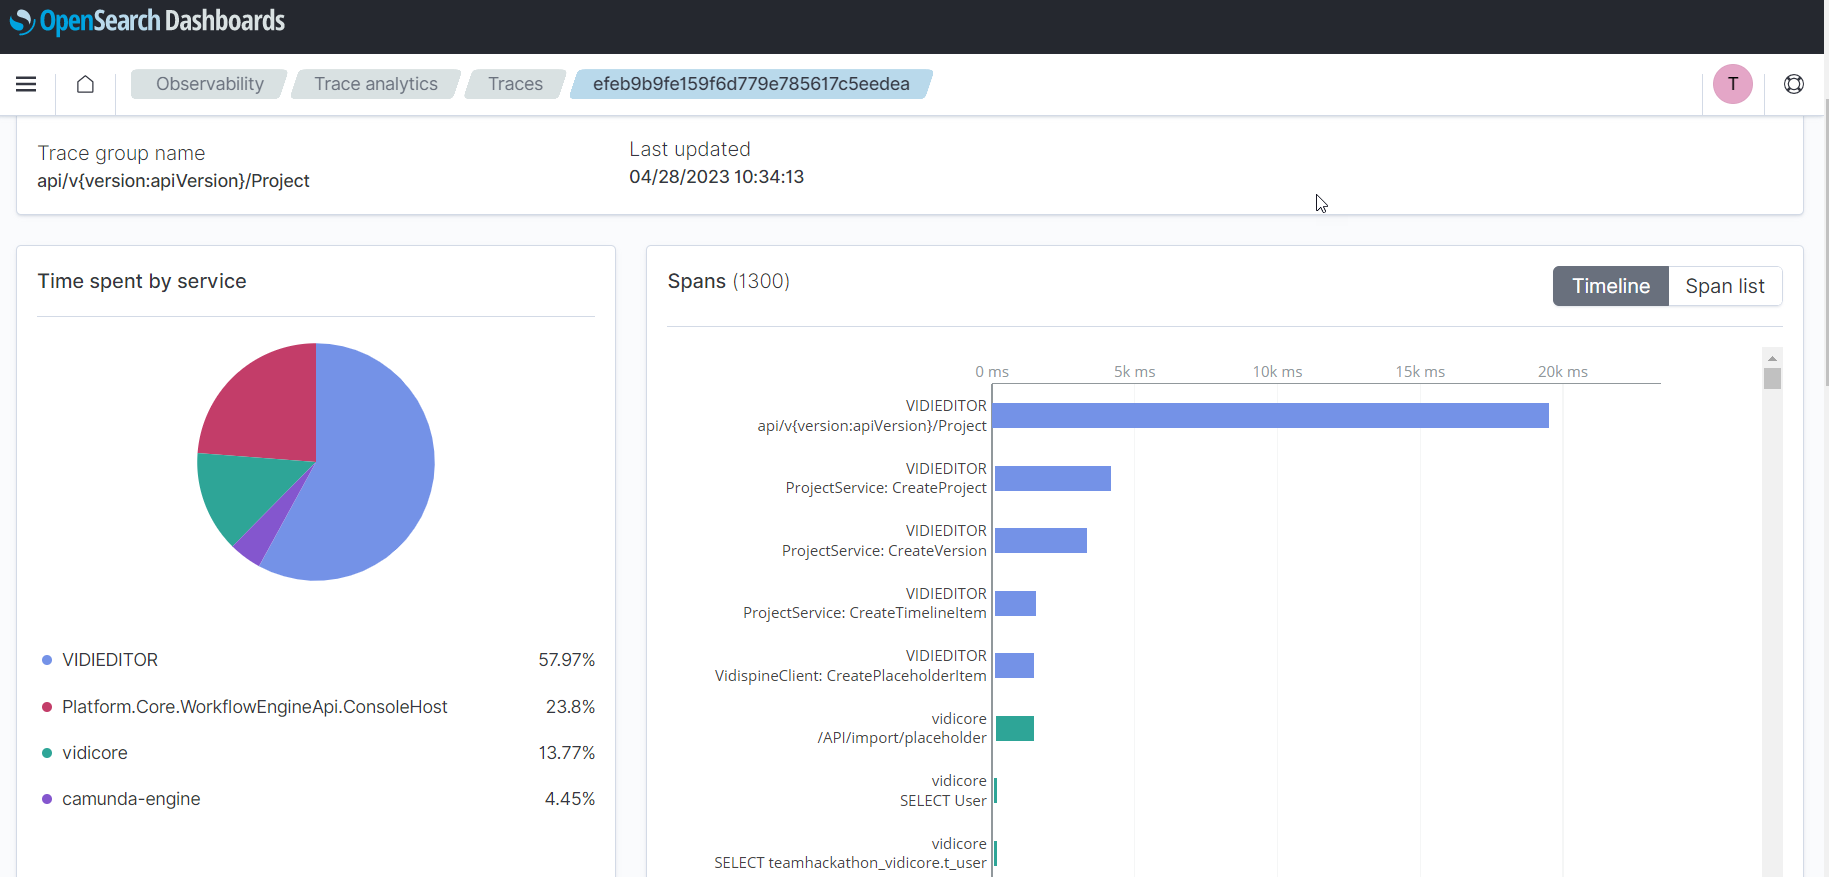
In the observability section, able to see the data in more detail compared to discover section. See this article for more information.
.png?inst-v=ac5a53fd-a319-41fb-80ef-9ab4c441b714)


