
Once users have defined a Discovery with the desired data, Kibana users have the option to apply the data set to a palette of different graphical representations known as "Visualizations".
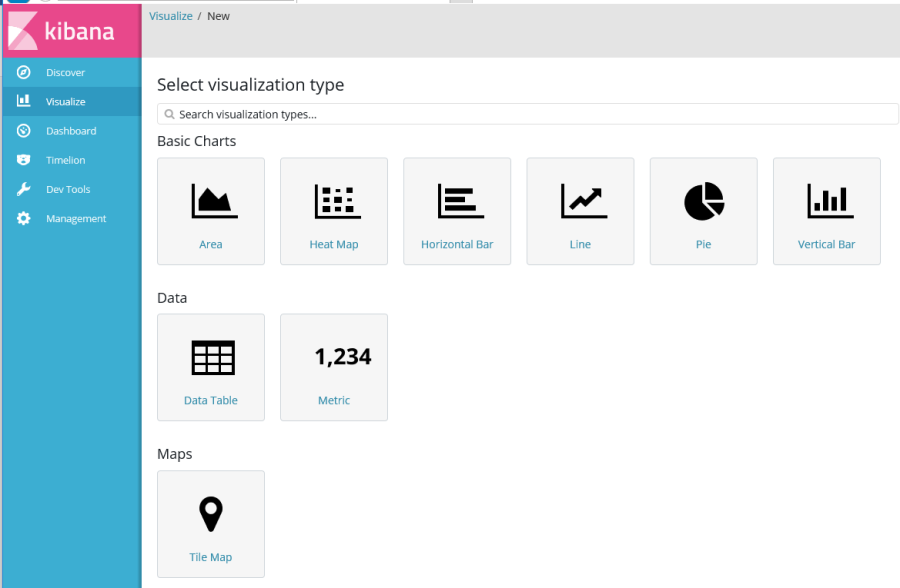
Each Visualization option has been optimized to represent or emphasize Discovery data in a different manner. With Discovery data saved separately, users have the option create multiple Visualizations for the same Discovery.