
The VidiFlow Workflow Monitor is the central web UI for monitoring workflow results and reacting on it.
Overview
The main layout of the Workflow Monitor consists of the following parts:
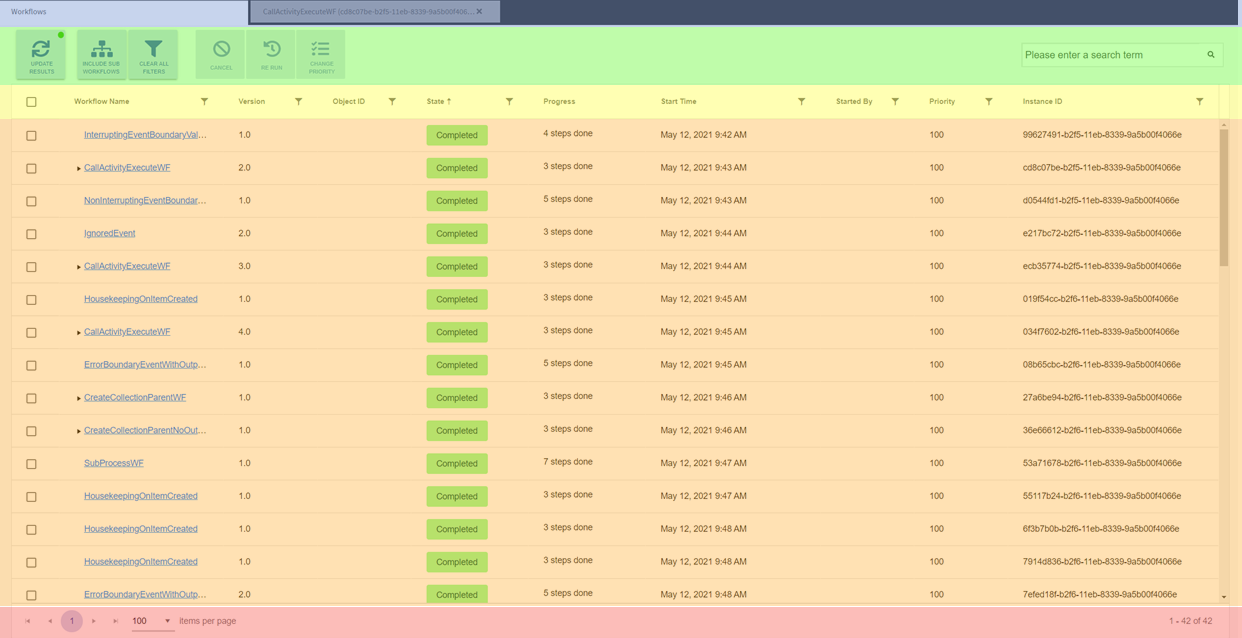
|
Color |
Section |
|---|---|
|
Blue |
The tab bar allows one to switch between the Workflows page and one or more workflow detail pages. |
|
Green |
The toolbar, which offers the function to adjust the main view, as well as a search function. |
|
Yellow |
The results table is the table header including the filtering and sorting options |
|
Orange |
The majority of the page is used up by the results table, where all the workflows matching the filter criteria are listed. |
|
Red |
Finally, at the bottom is the pagination control. This allows one to define how many results are returned per page and browse for more results. |
Workflow View
The main view of the Workflow Monitor shows the list of workflows, matching the filter criteria set by the user. By default, the most recent workflows across the whole system are displayed. This allows one to use the Workflow Monitor to view workflows that are currently in process, failed, or completed.
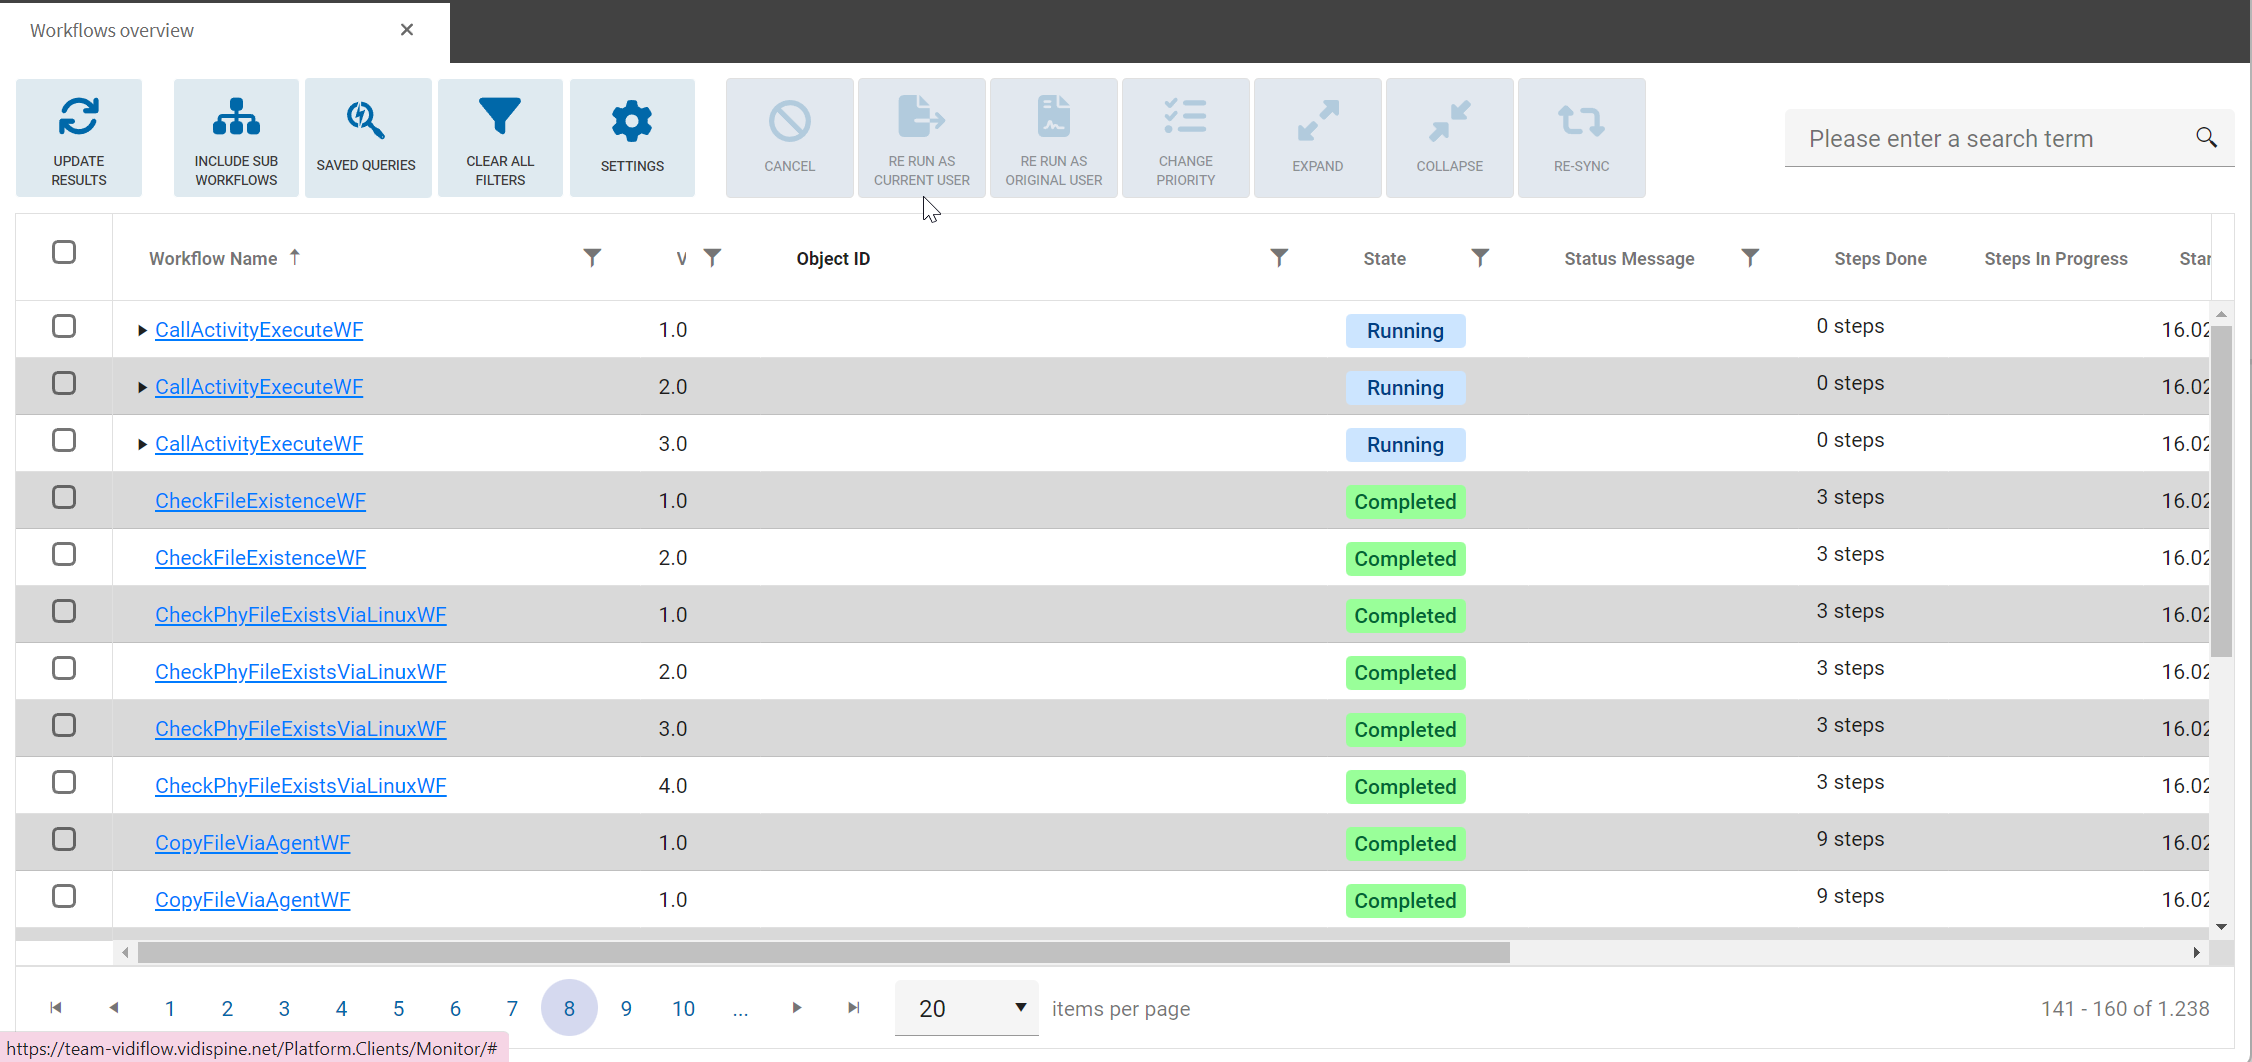
This view is always available in the first tab of the layout.
The following columns are available in the workflow list:
|
Column name |
Description |
|---|---|
|
<Selection checkbox> |
One or more lines can be selected to trigger actions in the toolbar |
|
Workflow name |
Name of the workflow (as defined in Workflow Designer) |
|
Version |
Version of the executed workflow |
|
Object ID |
ID of the main input variable (as defined in Workflow Designer) For items and collections, a link to the MediaPortal details view will be shown |
|
State |
Current state of the workflow (i.e. Running, Failed or Completed et al.) |
|
Status Message |
Status message string to give back status or error messages |
|
Steps Done |
The number of processed workflows steps |
|
Steps in Progress |
Current tasks of the workflow in progress or failed tasks (depending on workflows state) |
|
Start Time |
Date / time when workflow was triggered in the system |
|
Started By |
Name of user who initiated the workflow |
|
Priority |
Workflow priority |
|
Instance ID |
Unique ID of the workflow instance (technical parameter) |
|
Restart |
Icon to represent the restart state of a workflow (never restarted, restarted, restart copy) |
|
Relation ID |
ID to represent relations between restarted workflows and the restart copies |
Sorting
To change the sorting of the result list, users can click on a column header to change the sorting to the selected column and click again to switch between descending and ascending. This sorting is applied to the workflows that are currently included in the search results. Be aware that a limited set of results is returned, according to the filter criteria defined.
By default, the Workflow View shows the 1,000 most recent results.
Column configuration and metadata columns
It is possible to configure up to 5 metadata columns to be shown in the main view. This is managed centrally in ConfigPortal in a use case page “User Interfaces \ Workflow Monitor Columns”. Column configuration for VidiFlow Monitor [C OG].
Users can also change the default configuration for visibility and order of each Workflow Monitor column here. The settings are applied when the Worfklows Monitor is started with deleted browser data. In addition, this can be triggered manually by the "Reset" button in the "Settings" menu.
Adapting the UI
There are a few options to customize the Workflow Monitor to fit your needs. Changing these parameters will be remembered in your browser, so the user can customize this on every machine that they use.
Columns
The size of the columns can be changed by moving the column separator between the column headers with the mouse.
Changing the column order can be done by dragging a column header to another position.
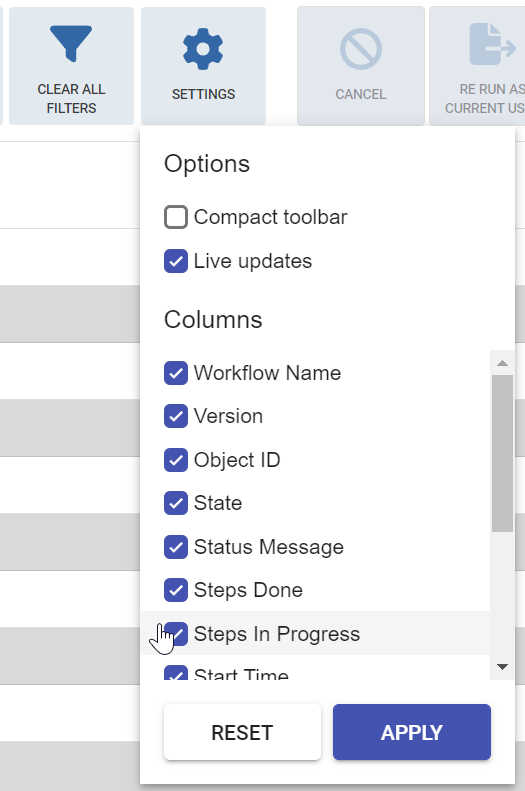
Configure visible columns
Columns can be shown or hidden via the options button on the top right corner of Workflow Monitor. This configuration is stored across sessions.
Pagination
Below the result list, pagination options are shown. The numbers on the left allow selecting another page, and the arrows allow for skipping forward and backward between pages, as well as jumping to the first or last page.
It is possible to change the maximum number of main workflows displayed on each page using the drop-down. This does not take Sub Workflows into account, so expanding the main workflow does not affect pagination, and will mean more results in total are displayed per page than selected.

On the right-hand side the user can see the number of results currently displayed, and the total count of results matching the filter criteria (limited to 1,000). If more results are available than can be returned, an icon is displayed that will allow hovering to see the total number of workflows matching the filter criteria.
The selected settings will be stored across sessions.
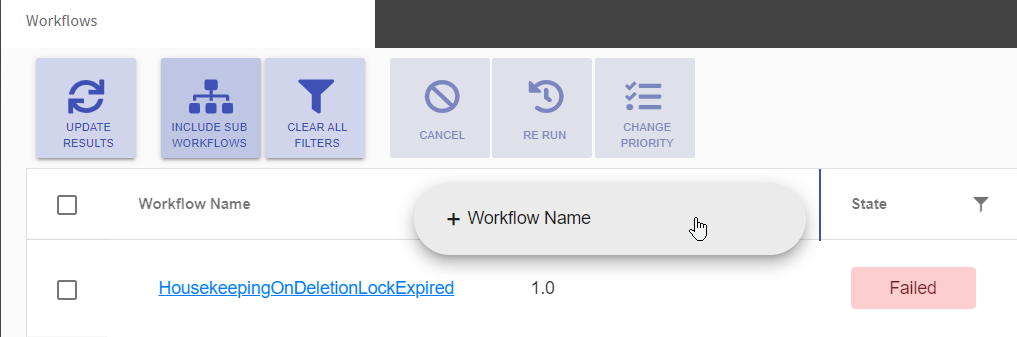
Sub-workflows
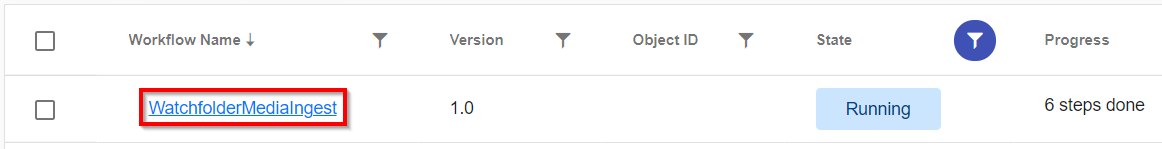
In the VidiFlow workflow engine, workflows can call sub-workflows as part of their execution. All workflows that contain sub-workflows display an “expand” icon next to the workflow name (see the following screenshot, marked red):

If you click on the button, the next level of sub-workflows is loaded and populated to the result list. The sub-workflows have the same columns compared to the main workflows, and are indented below the main workflow:

By clicking on the icon again, the sub-workflows will be hidden again.
Workflow trees can also be expanded and collapsed with toolbar buttons (see Toolbar).
Please note that the Workflow Monitor uses alternating background colors (white or grey) for alternating workflows. An expanded workflow tree always has one color for the whole tree.
Toolbar
On top of the main view, the toolbar gives users the following options:

-
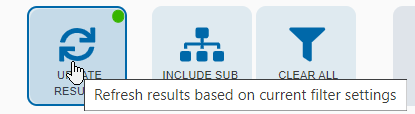
Update Results: Refreshes the result list based on the selected filters and search terms.
The button shows a green dot if new results are available. -
Include sub-workflows: This toggle button allows one to select if the filters should apply only on main workflows (default behavior, not selected) or also on sub-workflows (button selected).
-
Saved queries: See Saved Queries.
-
Clear all filters: All filter settings including the search term will be reset and results will be loaded (without filters set).
-
Settings:
-
Compact toolbar: Toggles the toolbar to show icons and text or only icons
-
Live updates: Switches live updates for running workflows on or off
-
Columns: Shows or hides each individual column
-
-
Cancel: The selected workflow(s) will be cancelled. Can only be selected for running workflows.
-
Rerun: Rerun the chosen workflow(s) with high priority, using either the current user or the original user.
-
Change priority: Change the priority of the selected workflow(s).
-
Expand: All selected workflows are expanded to show all subordinate sub-workflows.
-
Collapse: All selected workflows are collapsed to show only the main workflow.
-
Re-sync: It may happen that the workflow index, where Workflow Monitor is getting its data from, is not reflecting the correct current state. This button also to re-sync the workflow index for a single selected value. When the workflow index was updated, the green indicator on “update results” show light up.
-
Search term: Please refer to Search Term.
All toolbar buttons show descriptive text in the tool tip for mouseover.
Toolbar buttons may be hidden dependant on user’s rights.
Filtering Search Results
It is possible to adjust the search results by setting detailed filters or entering a search term.
Filters
Filters can be set in the header of the table by selecting the filter symbol. Most columns provide different filtering options based on the data type of the column. If you enable multiple filters, all are combined with a logical AND operator. This means that all criteria must be valid in an item for a match to be triggered and appear as a result.
The following filter options are available:
|
Filter on column |
Description |
|---|---|
|
Workflow name |
The user can enter the name of one or more workflows. Offers auto-complete if at least three characters are entered. Multiple workflow names can be entered. It is also possible to enter one or more workflows names and exclude them from the list. |
|
Version |
Filtering on version only allows the option “is equal to”. Enter the desired workflow version (e.g. “2.0”) |
|
Object ID |
Filter for the object ID the workflow was started on. Note: To enable showing the object ID, the workflow parameter ‘Workflow Object Id’ has to be set in Workflow Designer for each workflow. |
|
State |
Allows one to select one or more states of the workflows |
|
Status Message |
Filter for specific text in the status message |
|
Start Time |
Allows one to enter the time span when a workflow was started. Most common presets are available for quick selection. |
|
Started by |
Allows one to filter for the user who initiated a workflow. |
|
Instance ID |
Allows one to filter for the unique id of the workflow instance. |
|
Relation ID |
Allows one to filter for the relation id of the workflow instance. The allows to find multiple workflow instances that were started from one initial workflow. |
Each filter has a button to clear the current filter. Additionally, you can select the toolbar button “Clear filters” to completely reset your filter selection.
If a filter is set, the corresponding button is marked blue (like for Workflow Name and State in the following screenshot:

The maximum number of results is limited to 10,000 workflows. The user can use the filtering options to reduce the results or to return a different set of results according to the filter criteria.
Since Version 21.4 the filter for Start Time is set to “today” on startup to increase the start speed of the Workflow Monitor.
If you experience performance issues on the Workflow API due to the higher result limit, the limit can be changed to lower values.
Search Term
In addition to using filters, it is also possible to enter a search term on the right-hand side of the toolbar. This gives the user a powerful option as it searches through values of the workflow contracts which are not shown in dedicated columns, e.g. the input and output parameters of workflows.
The search term will be used as an exact match, but case-insensitive. To search for substrings one can use the following placeholders (which can be combined):
|
Placeholder |
Intention |
Example |
|---|---|---|
|
abc* |
Text starting with ‘abc’ |
‘house*’ finds 'HouseKeeping' |
|
*abc |
Text ending with ‘abc’ |
‘*project' finds 'CreateProjects’ |
|
a*b |
Text starting with ‘a' and ending with 'b’ |
‘ho*ing’ finds ‘HouseKeeping’ |
|
a?b |
Any character for ? |
‘d?al’ finds ‘deal’ and 'dial' |
If you enter a search term and additionally use one or more filters, all are combined with a logical AND.
Saved Queries
The Workflow Monitor supports defining saved queries. This is very useful to store queries that are often used in a user's daily work. There are two kinds of saved queries, which are documented in the following chapters.
User queries
User queries are stored in the local browser cache. The defined user queries will be shown as different sub-menu entries.
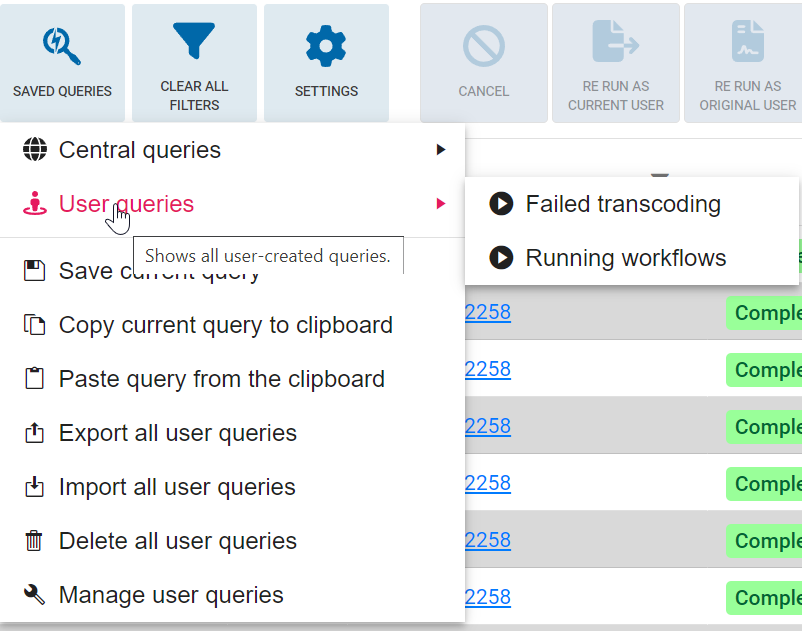
The following menu items are available and useful for user queries:
|
Menu item |
Description |
|---|---|
|
Save current query |
Saves the current active filter as a query with a name and description. |
|
Copy current query to clipboard |
Copies the currently active query to the clipboard. This is useful to create a central query (see Central Queries or to share a query with another user. |
|
Paste query from the cliopboard |
Pastes a query from the clipboard and activates it. |
|
Export all user queries: |
Exports all locally storey queries to a text file and downloads it. |
|
Import all user queries: |
Import previously exported text files containing queries and stores them as user queries. |
|
Delete all user queries |
After the user’s confirmation all user queries will be deleted. |
|
Manage user queries |
Opens a dialog allowing to rename or delete user queries |
There is a limit of a maximum of 20 saved queries
User queries are stored in the local browser cache. Deleting the cache will delete the queries. Therefore, it is highly recommended to export important queries and restore them if necessary.
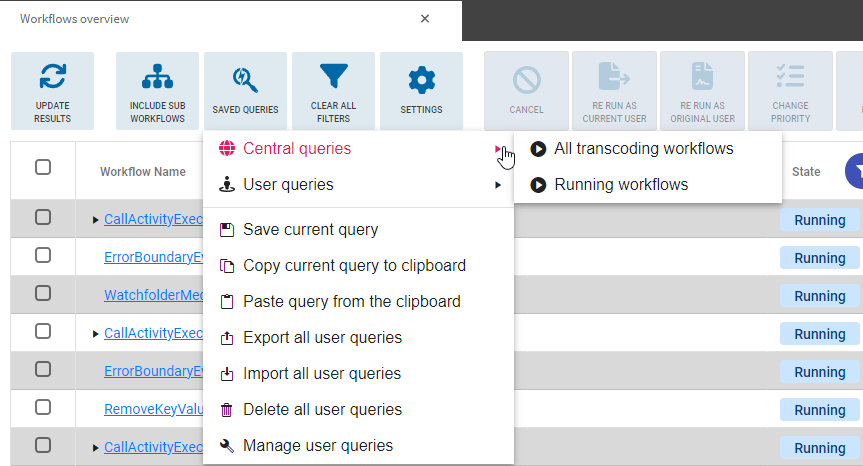
Central Queries
Central queries can be configured in ConfigPortal and will be available for all users who are members of the configured user groups (see https://kb.vidinet.net/central/latest/central-queries-for-vidiflow-monitor-c-og).
All configured queries will be shown in alphabetical order in the sub-menu “Central queries”
If issues with the connection to VidiCore appear, it may not be possible to resolve the user assignment to the configured groups. In this call, all available groups will be shown, also if the user is not part of the groups.
Workflow Prioritization
Prioritization offers one the possibility to set a workflow instance priority when starting a workflow or to change it on running workflows. This will not affect the priority of the workflows themselves in Camunda, but it will use the current priority of a workflow to automatically adapt the priority for all tasks in the Rabbit MQ message bus.
Priorities can be set between 1 (lowest) and 10 (highest). The default priority is 5.
Changing Priority in the Workflow Monitor
The toolbar option “Change priority” allows changing the priority of one or more selected workflow instances in the state “not started” or “running”.
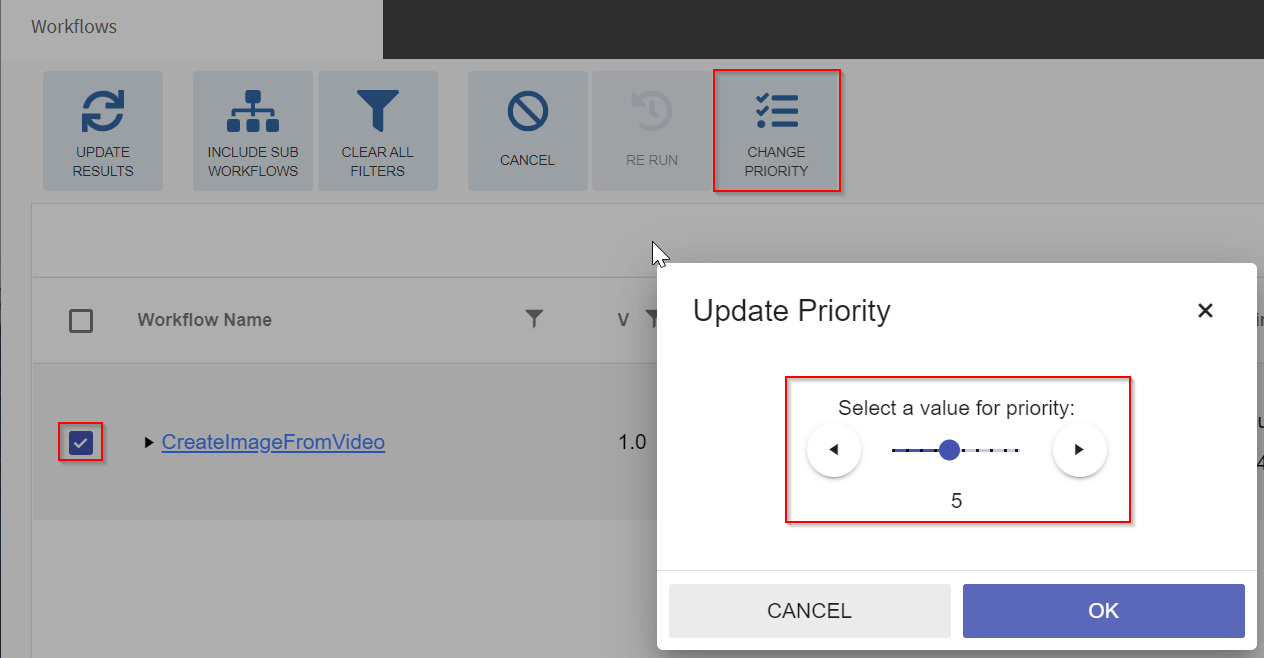
Changing priority in Workflow Monitor
The priority of the workflow instance and each task is available now in the details view.
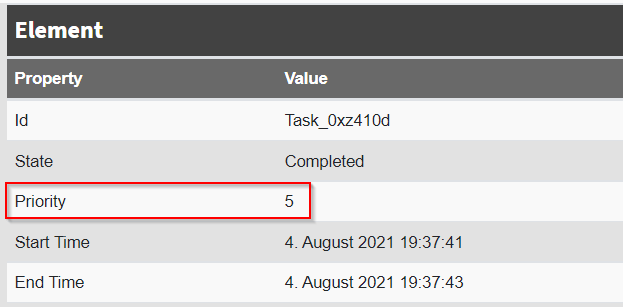
Priority in Workflow Monitor details view
Details View / Workflow Instance View
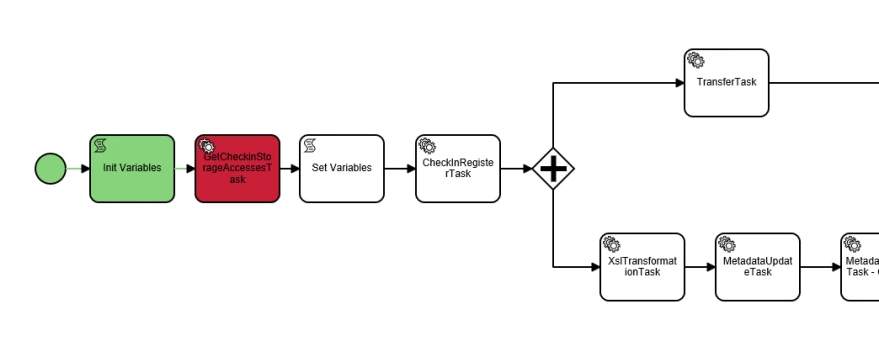
The Details View of Workflow Monitor shows all the details of a workflows including the BPMN diagram with the tasks status represented by colors.
Opening the Details View
Clicking on the hyperlink on a search result's workflow name will open a new tab in the Workflows Monitor. Each tab is dedicated to displaying both the workflow's model as well as specific information particular to the workflow's instance.
Clicking on the link while holding down the Ctrl key opens the new tab without displaying it directly. This makes it possible to open several tabs quickly for later analysis.
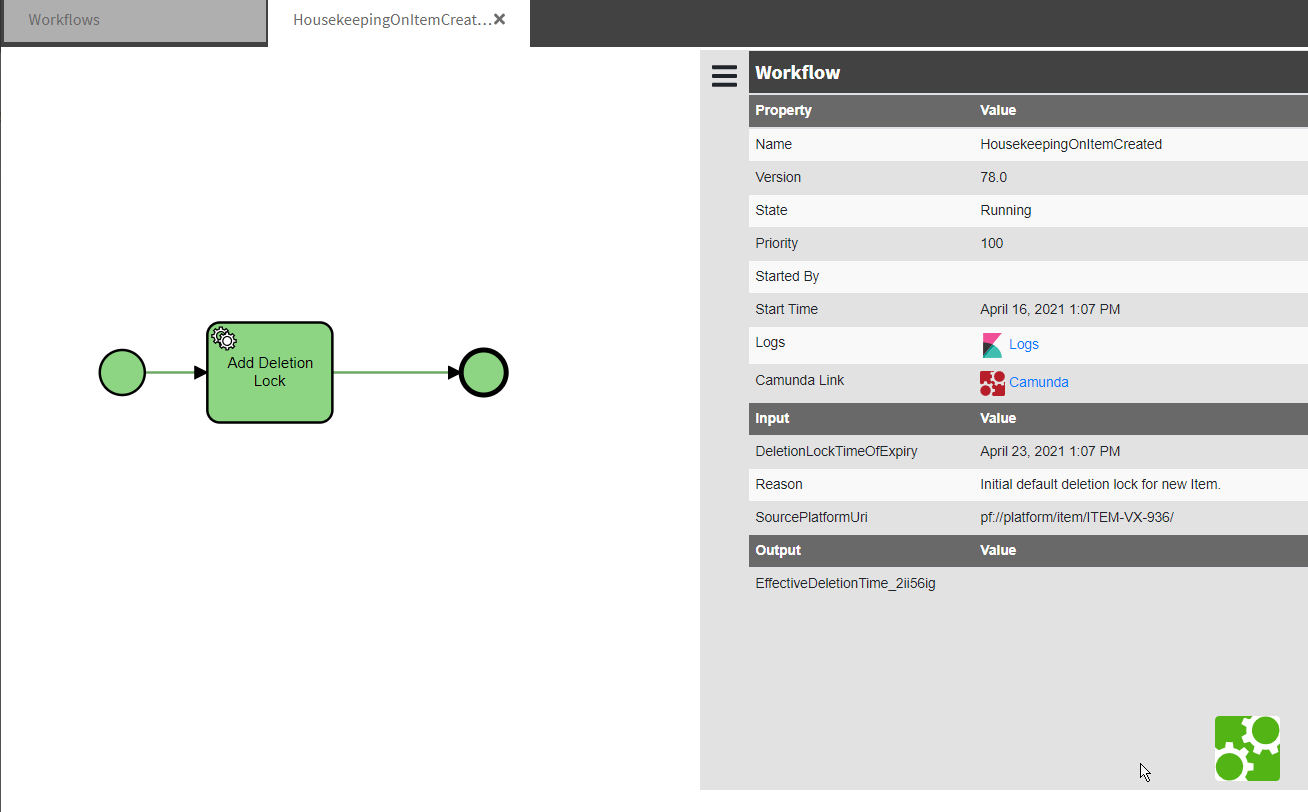
Details View overview
The Instance View is divided into two sections. One is the Workflow Diagram and the other a Workflow Details Table.
It is important for VidiFlow users to note that, unlike a workflow modeler, the Instance View offers only a visualization of the workflow instance and therefore delivers detailed information for each individual step useful for process tracing and error analysis. Users are not able to actively modify the model or any of its parameters through the Workflow Monitor itself. Should a user with the correct set of rights assigned wish to modify the workflow model that the workflow instance is based on, they would have to do so via ConfigPortal and the Workflow Designer.
Workflow Diagram
The Workflow Diagram located within the Instance View is based on principles shared with the Workflow Designer. VidiFlow users are able to select individual elements in the workflow, all of which follow the Business Process Model Notation (BPMN) standard. Because VidiFlow workflows are supported by the Camunda engine, all workflow models are BPMN compliant.
Just as in a modeler, VidiFlow users are able to zoom in and out of the map with the scroll wheel of their mouse by holding the Ctrl key on their keyboard. Using the mouse wheel allows one to shift the map center to a preferred element (hold the Shift key to move horizontally). This function is particularly helpful when attempting to view specific portions of the Workflow Diagram in detail.
For more information on BPMN and the Camunda workflow engine, please see Workflow Design and Modeler Based on Camunda Engine & BPMN 2.0
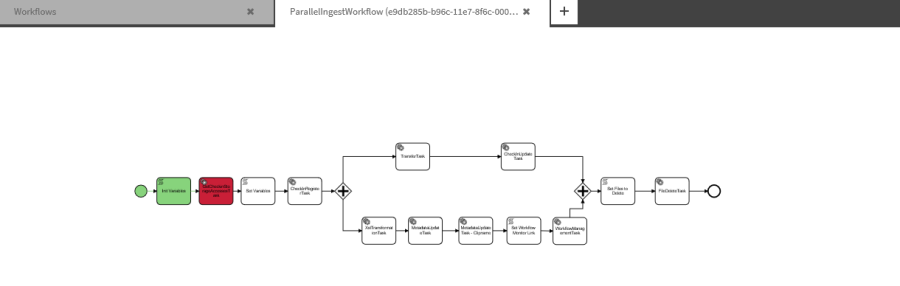
Workflow Diagram: Indicators
As shown in the example below, the Workflow Diagram can be zoomed to any stage of the workflow. The Diagram also displays elements that have been completed. Color codes indicate the state in which the elements, events, or activities have been completed successfully or triggered an incident.
|
Color code |
Description |
|---|---|
|
Events and activities that have been completed successfully are filled in with green. |
|
Events and activities that have experienced incidents are filled in with red. |
|
Events and activities that have yet to trigger are filled in with white. |
|
Events and activities currently in execution are filled in yellow.
|
|
Canceled events and activities that have been canceled and thrown an interrupting boundary event are filled in purple. |
The Monitor is not limited to showing the diachronic state of the workflow. If a workflow is running while the Monitor is being used to show the model, it will display the state of the workflow in real time.
Elements that have been marked in yellow indicate elements or steps in the workflow which are currently being processed. Running workflows will express the running state as well as show an incomplete progress bar.
Workflows Details Table
The Workflows Details Table is located on the right-hand side of the Instance View.
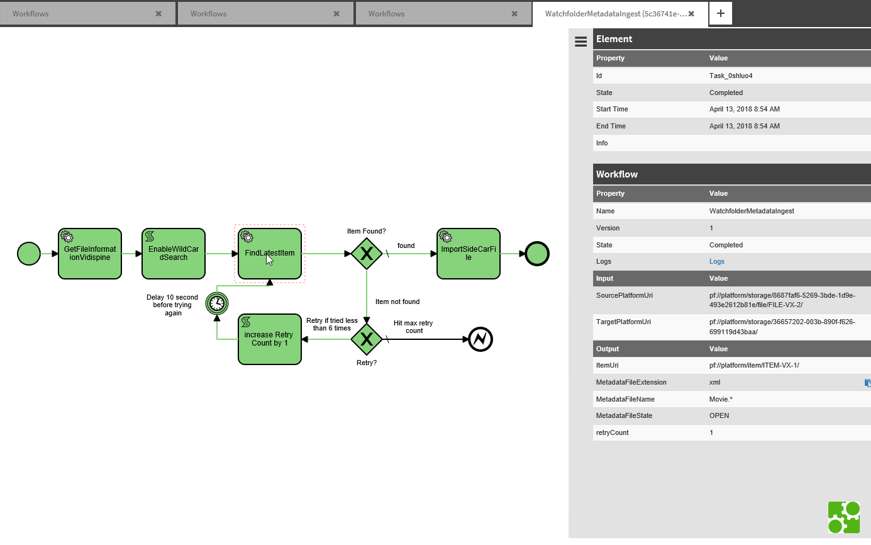
The upper section Workflows Details Table is dedicated to displaying information related to a particular element in the workflow model. Below that general information for the whole workflow is displayed. Please note that the information displayed will vary based on the element selected on the Workflow Diagram.
One can also get additional information for a task:
-
Some basic info for elements/nodes that are not run (e.g. id)
-
The boundary event names for boundary event
Possible actions
Some actions are supported in the details table:
-
Logs can be opened in OpenSearch Dashboard with filtering on the whole workflow or on a specific task
-
The Camunda cockpit can be launched for the workflow
-
Task having raised an incident can be retried or canceled via specific buttons.
-
Open the workflow called by a call activity by clicking on the link shown in “Activity Instance(s).
-
Open the calling workflow of a sub-workflow by clicking on “Open calling workflow”.
Functional Roles
The Workflow Monitor supports functional roles to apply the functional rights to different user roles. The following table shows the existing roles and the corresponding functional rights:
|
Name |
Description |
PF_WfMonArvato |
PF_WfMonAdmin |
PF_WfMonSupport |
PF_WfMonReadOnly |
PF_WfMonUser |
|---|---|---|---|---|---|---|
|
WfMonOpenMonitor |
Open the workflow monitor |
x |
x |
x |
x |
x |
|
WfMonSeeAllInstances |
See all workflows regardless of who started it |
x |
x |
x |
x |
|
|
WfMonOwnInstances |
See workflows started by yourself |
x |
x |
x |
x |
x |
|
WfMonCancelTask |
Cancel selected workflow(s) |
x |
x |
|
|
|
|
WfMonRestart |
Restart selected workflow(s) |
x |
x |
x |
|
|
|
WfMonRestartCurrentUser |
Restart selected workflow(s) with current user’s rights |
x |
x |
|
|
|
|
WfMonSetPriority |
Change the priority of selected workflow(s) |
x |
x |
x |
|
|
|
WfMonViewLog |
See link to OpenSearch Dashboard for log monitoring |
x |
x |
x |
x |
|
Workflow Rerun
Overview
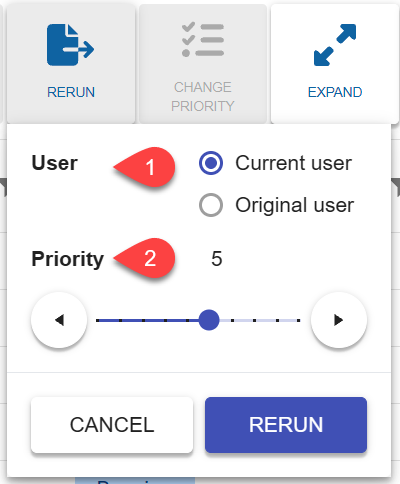
The Workflow Rerun feature allows users to restart one or more previously executed workflows. Users can specify whether to rerun workflows as themselves ("Current user") or as the original workflow initiator ("Original user"), and can optionally adjust the rerun priority level. Access to these options is governed by user permissions.
Feature Details
User Selection
-
Current User:
By default, workflows are rerun under the identity of the user initiating the rerun action. -
Original User:
Users may choose to rerun workflows as the original initiator. This option is only available if the user has thePF_WfMonRestartOriginalUserpermission.-
If the user lacks this permission, the "Original user" radio button is disabled and cannot be selected.
-
Priority Setting
-
Priority Selection:
Users can set the priority for the rerun operation using a slider control.-
If a single workflow is selected, the workflow's original priority is used.
-
If multiple workflows are selected, the default priority is set to
5.
-
-
Permission Restriction:
The ability to modify priority is controlled by thePF_WfMonSetPrioritypermission.-
If the user lacks this permission, the priority slider is disabled.
-
Rerun Action
-
RERUN Button:
Initiates the rerun of the selected workflow(s).-
The button is only enabled for users with the
PF_WfMonRestartpermission. -
If the user lacks this permission, the "RERUN" button is disabled and the rerun operation cannot be performed.
-
Usage Instructions
-
Navigate to the Workflow Monitoring Interface.
-
Select the workflow(s) you wish to rerun.
-
Choose User Context:
-
By default, "Current user" is selected.
-
If enabled, select "Original user" to rerun as the original initiator.
-
-
Set Priority (Optional):
-
Adjust the priority slider if you wish to override the default behavior.
-
Note: This is only available if you have the
PF_WfMonSetPrioritypermission.
-
-
Initiate Rerun:
-
Click the "RERUN" button to start the rerun process.
-
Note: The button is only enabled if you have the
PF_WfMonRestartpermission.
-
Permission Reference
|
Permission |
Controls |
UI Effect |
|---|---|---|
|
PF_WfMonRestartOriginalUser |
Rerun as original user |
Enables/disables "Original user" radio button |
|
PF_WfMonSetPriority |
Set rerun priority |
Enables/disables priority slider |
|
PF_WfMonRestart |
Initiate workflow rerun |
Enables/disables "RERUN" button |