
On this page, one can inspect pool utilization for a specific pool.
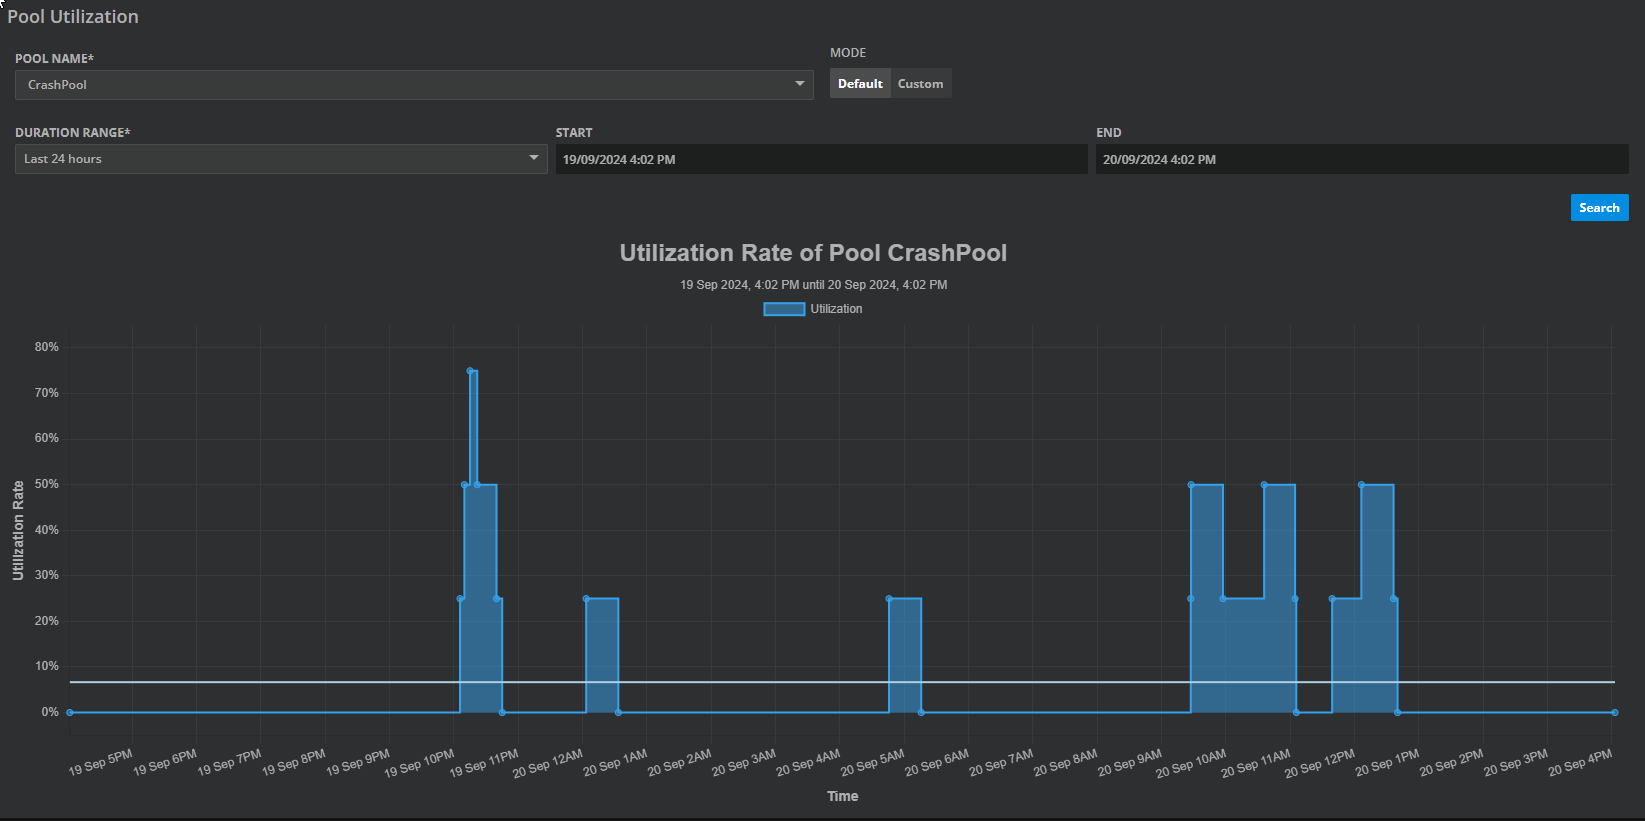
After a pool is selected, a time range can be selected. A click on the Search button then loads the result.
To specify a custom time range, switch from Default to Custom and enter start and end. A click on the Search button loads the result:
