
VidiEditor offers the following possibilities when it comes to monitoring:
-
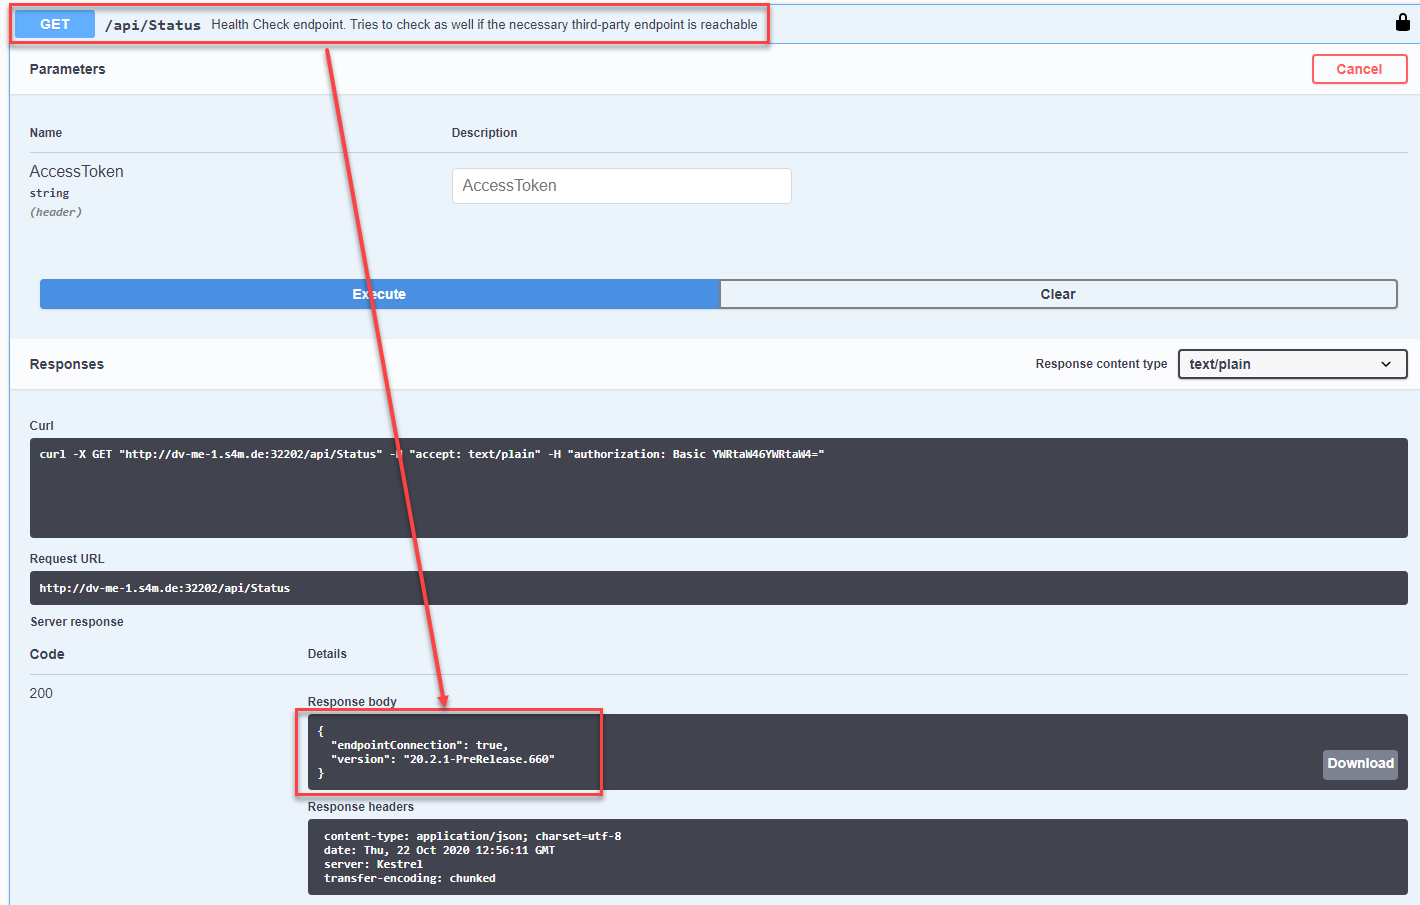
Health Check API Endpoint that can be pulled to request VidiEditor’s status. This API call can be used to ping the status and version of VidiEditor’s installation:
http://ServerName:Port/api/Status
Alternatively, Swagger can be used:
GET: http://ServerName:Port/swagger/index.html#/Status/HealthState
-
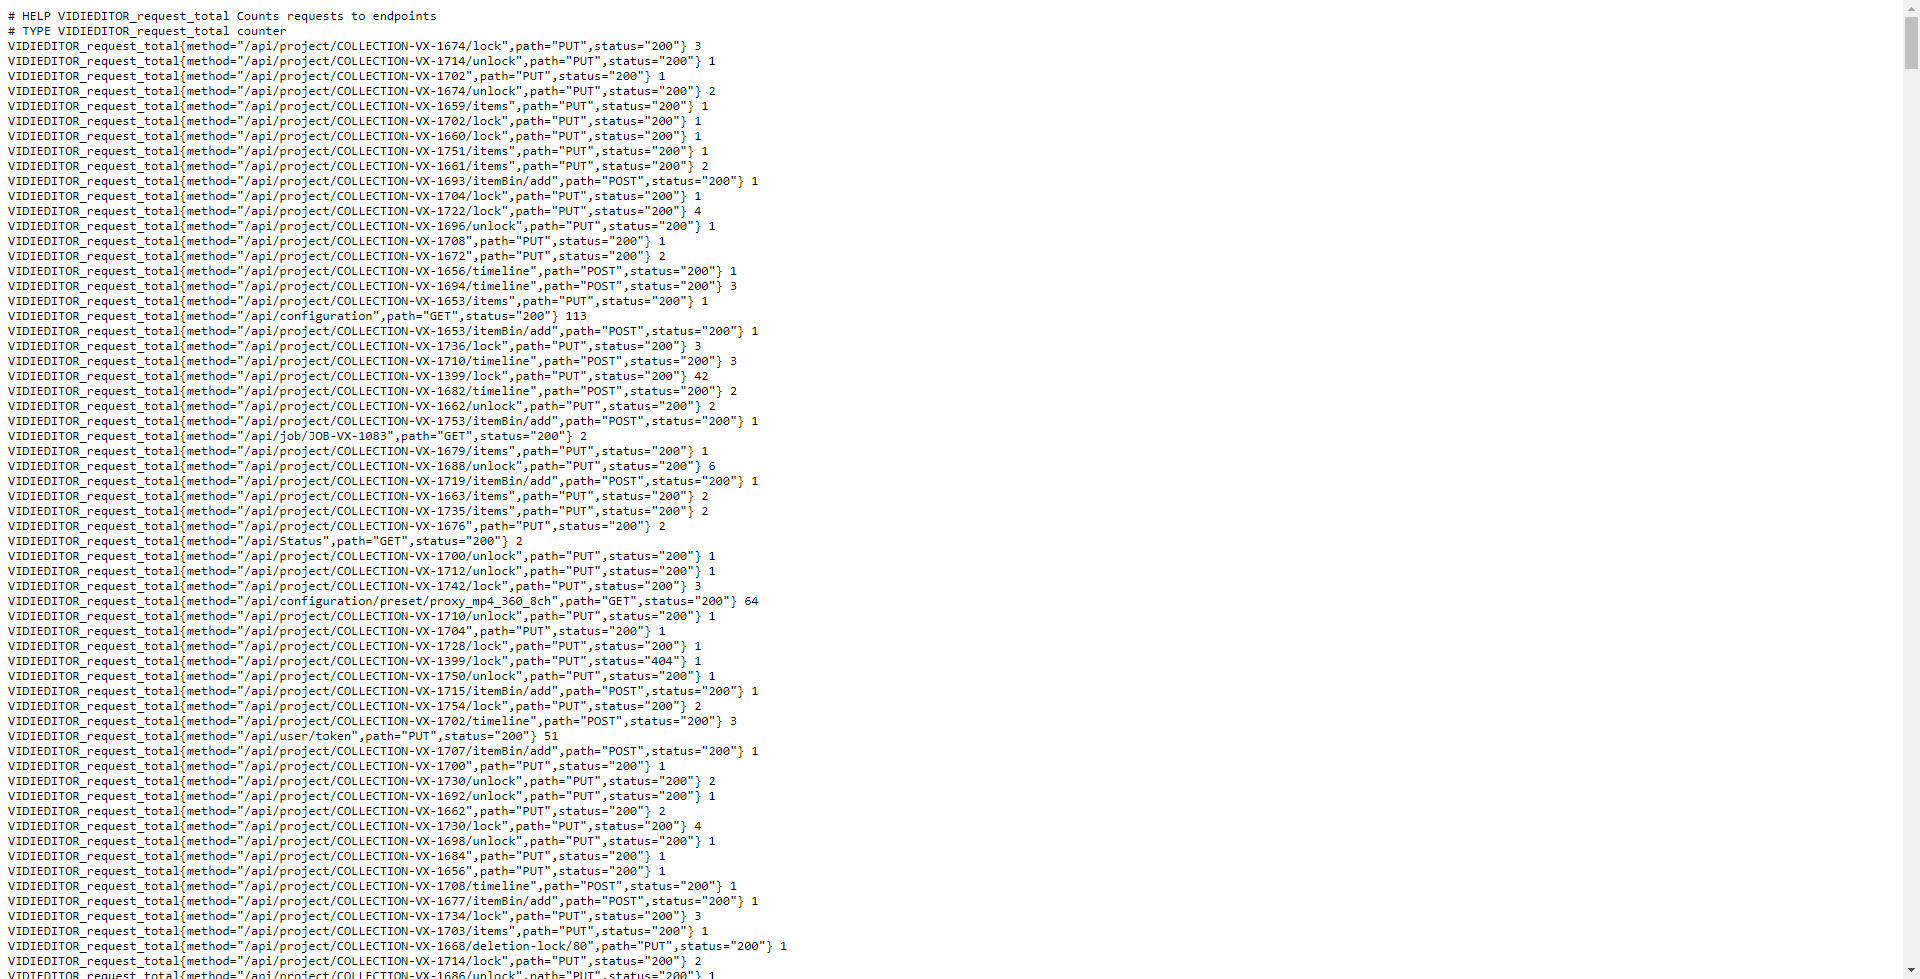
The interface for Prometheus Metrics is used to build KPI’s using Grafana. This allows one to build Grafana dashboards visualizing different KPI’s based on metrics the VidiEditor aggregates. The aggregated data can be fetched using following API route:
GET: http://Servername:Port/metrics
A sample result is shown below:
At the moment, metrics data exposed from VidiEditor are the ones with these prefixes:
-
VIDIEDITOR_xx
-
http_xx
-
dotnet_xx
-
process_xx

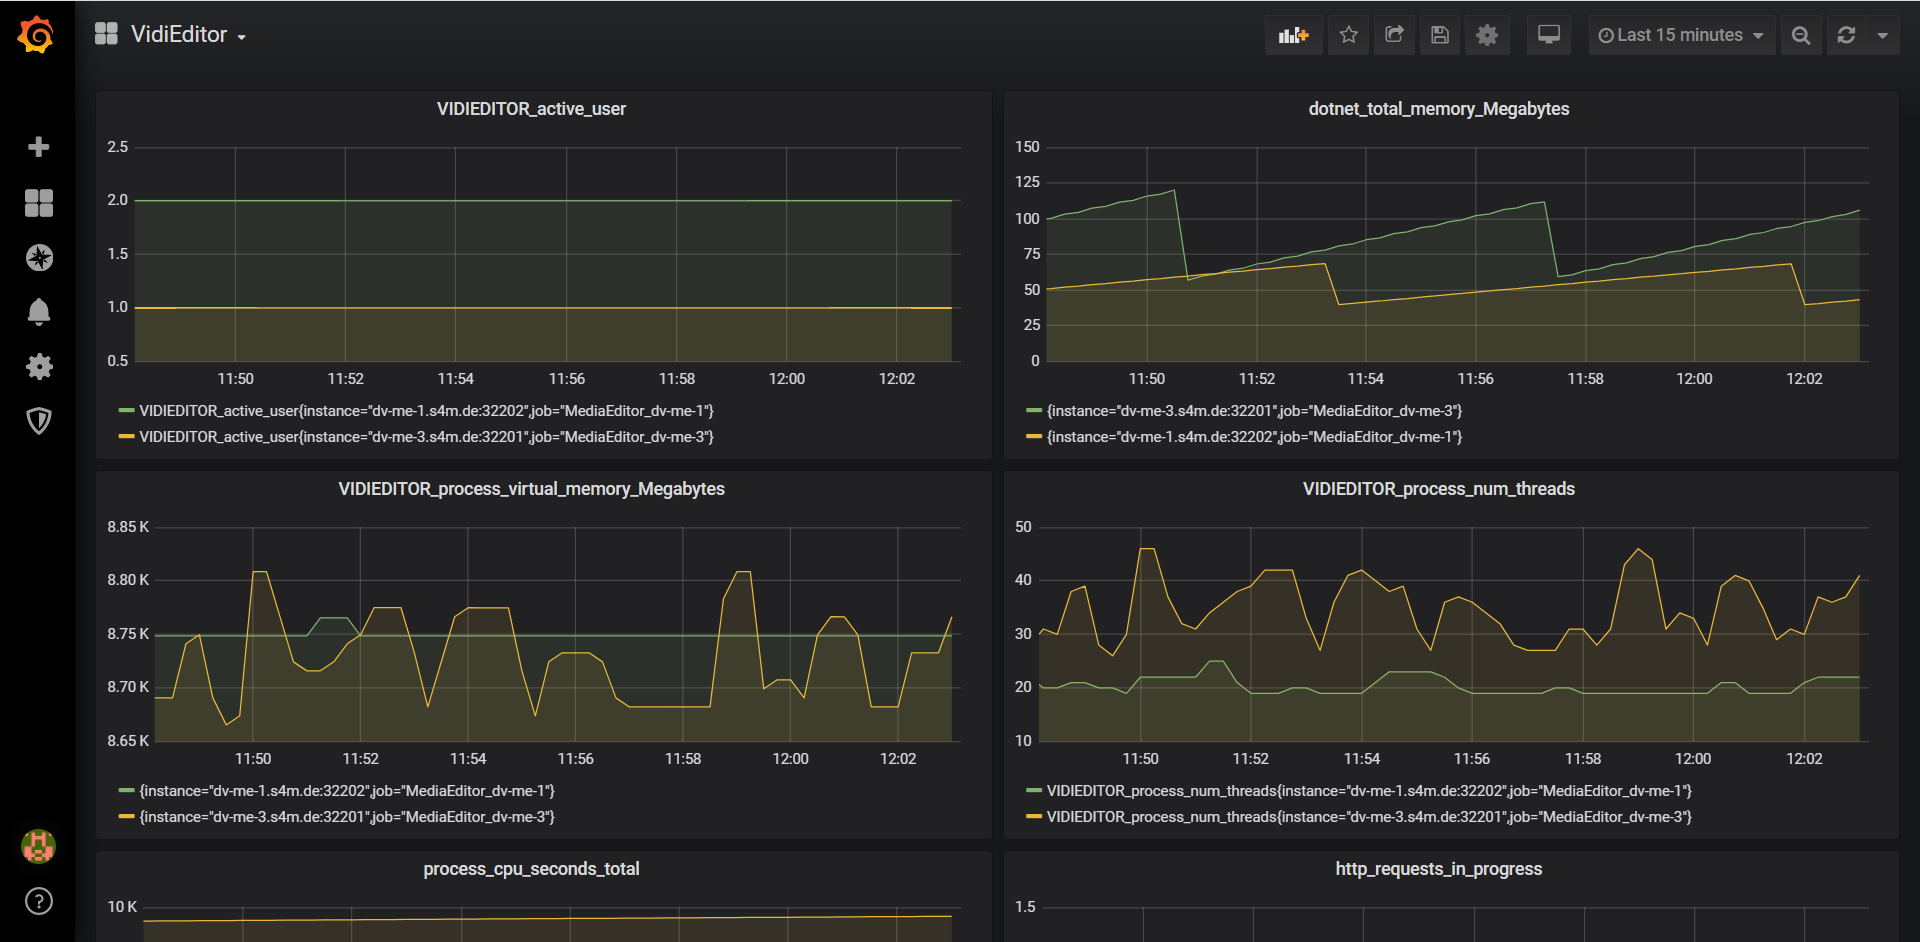
You can freely choose which metric data you want to visualize in the dashboard to monitor the application.
Here is a sample of a dashboard in Grafana with VidiEditor metrics data.
How to configure VidiEditor as a target in Prometheus
After you have Prometheus server up and running, you can configure Prometheus to monitor VidiEditor as one of the targets. Add VidiEditor’s endpoint into 'static_configs' in 'scrape_configs' section in your prometheus.yml and restart your Prometheus instance as shown in the sample below:
# A scrape configuration containing exactly one endpoint to scrape:
# Here it's Prometheus itself.
scrape_configs:
  # The job name is added as a label `job=<job_name>` to any timeseries scraped from this config.
  - job_name: 'prometheus'

    # metrics_path defaults to '/metrics'
    # scheme defaults to 'http'.

    static_configs:
    - targets: ['localhost:9090']

  - job_name: 'VidiEditor
    # The HTTP resource path on which to fetch metrics from targets.
    metrics_path: /metrics
    static_configs:
    - targets: ['ServerName:Port']
How to add Prometheus metrics into Grafana:
-
Once in Grafana, click on the "cogwheel" in the sidebar to open the Configuration menu.
-
Click on "Data Sources".
-
Click on "Add data source".
-
Select "Prometheus" as the type.
-
Set the appropriate Prometheus server URL (for example,
http://localhost:9090/) -
Adjust other data source settings as desired (for example, choosing the right Access method).
-
Click "Save & Test" to save the new data source.

Info from Grafana’s site: https://prometheus.io/docs/visualization/grafana/#creating-a-prometheus-data-source